Understanding forex charts and knowing the right market sessions can help traders improve their results. Many beginners lose money not because of bad strategies but because they trade during quiet hours or ignore clear chart signals. Studying price movement and knowing when the market is most active can increase trading accuracy.
Forex chart analysis means watching trends, support and resistance, and candle patterns. During the London session, major pairs such as EUR/USD and GBP/USD usually show strong moves that allow better trade opportunities. By combining technical reading with correct session timing, traders can find stronger signals and reduce losses.
Understanding Forex Charts
Forex charts are the primary tools traders use to study price behavior and market patterns. They visually represent currency movements over time, allowing traders to make decisions based on real data rather than emotion. Every price move on a chart reflects the market’s reaction to global news, interest rate changes, or major financial events. Learning to read these charts accurately is one of the first steps toward becoming a skilled trader.
What Are Forex Charts
Forex charts display price changes for currency pairs within specific time intervals — from one minute to one month. The most commonly used types are line, bar, and candlestick charts. Each chart type offers a different level of detail, helping traders identify trends and patterns that shape trading opportunities.
How Charts Help Traders
Charts help traders recognize market direction, trend strength, and reversal points. They make it easier to spot entry and exit zones for buy or sell trades. By comparing price action across time frames, traders can build strategies that match their trading style — short-term or long-term.
Types of Forex Charts
Different chart types provide unique insights, so understanding their purpose is crucial.
Line Chart
A line chart connects closing prices over a selected time period, forming a simple, continuous line. It’s easy to read and best for beginners who want to focus on general price direction without too much detail.
Candlestick Chart
Candlestick charts show open, close, high, and low prices for each period. The color and shape of candles indicate market sentiment — green or white for buying pressure, and red or black for selling. These charts give clear visual clues about reversals, continuation patterns, and trader psychology.
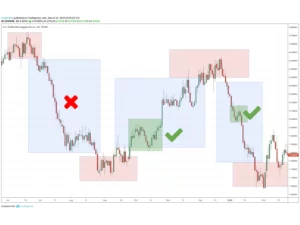
Reading Price Action Correctly
Price action reflects the true behavior of buyers and sellers in the market. By analyzing how price moves, traders can predict future trends without relying too heavily on indicators.
Spotting Trends
A trend shows the market’s main direction — an uptrend forms higher highs and higher lows, while a downtrend forms lower highs and lower lows. When prices move sideways, it indicates market indecision.
Using Trend Information
For instance, if EUR/USD forms higher highs during the London session, it signals strong buying pressure. Traders can enter positions on pullbacks or after minor corrections, aligning with the dominant market trend.
Key Forex Trading Sessions
The forex market operates 24 hours a day across different global sessions. Understanding when each session opens helps traders find the most active and profitable periods.
| Session | Time (IST) | Activity Level |
|---|---|---|
| Sydney | 5 AM – 2 PM | Low to Medium |
| Tokyo | 6:30 AM – 3:30 PM | Medium |
| London | 12:30 PM – 9:30 PM | High |
| New York | 5:30 PM – 2:30 AM | High |
The overlap between London and New York sessions (5:30 PM – 9:30 PM IST) provides the highest volatility and trading volume. Most traders find better opportunities during this time due to faster price movement and increased liquidity.
Combining Chart Analysis with Sessions
The timing of a trade often determines its success. Combining session awareness with technical analysis improves accuracy.
How Timing Affects Results
Trading major pairs like EUR/USD or GBP/USD during their most active sessions increases liquidity and reduces slippage. Signals generated during these times are usually more reliable.
Using Market Activity
A buy setup on GBP/USD before the London session opens tends to move quickly once volume increases. Avoid placing trades during inactive hours like late Asian session, where market movement is limited.
Important Indicators for Chart Analysis
Indicators help confirm price action and provide signals for entry, exit, or reversal.
Popular Tools
- Moving Averages: Identify overall trend direction.
- RSI (Relative Strength Index): Shows overbought or oversold market conditions.
- MACD: Detects changes in trend momentum.
- Bollinger Bands: Measure volatility and potential breakouts.
Combine RSI with support levels for stronger trade confirmation. When RSI moves above 30 while the price stays near a support area, it signals potential buying strength. Similarly, if RSI drops below 70 near resistance, it can hint at a reversal.
Using Time Frames for Better Decisions
Analyzing multiple time frames gives a broader market perspective and helps refine entries.
Multiple Time Frame Method
Higher time frames (like H4 or Daily) show the main direction, while smaller ones (like M15 or M30) highlight short-term patterns.
Applying It Correctly
If the daily chart shows an uptrend, look for buying opportunities during pullbacks on lower time frames. This alignment increases the probability of successful trades.
Building a Daily Trading Routine
A structured daily plan helps you analyze markets effectively and avoid random trades.
- Check the economic calendar for important news.
- Identify the main trend on the daily chart.
- Mark support and resistance zones.
- Wait for active trading sessions before taking trades.
Repeating this process daily builds confidence and improves accuracy. Over time, you’ll develop the ability to read market behavior faster and react with discipline instead of emotion.
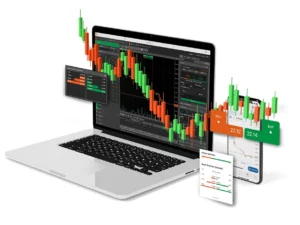
Tools and Platforms for Chart Analysis
Modern trading platforms make it easier to analyze price movements and test strategies.
Best Tools for Beginners
- MetaTrader 4 (MT4) / MetaTrader 5 (MT5): Widely used platforms with full charting features.
- TradingView: Offers web-based charting with custom indicators.
- cTrader: Provides fast execution and detailed analytics.