Technical indicators form a significant component of forex trading. They help investors understand the price action, find trends, and time entries with greater accuracy. Indicators are statistical formulas applied to price data that report patterns, momentum, and volatility in the marketplace. Market newbies often find it difficult to read the price charts, but with indicators, it is easier to identify buy and sell opportunities.
Trading with indicators is reading what the market is already saying — not predicting. A moving average smooths out random fluctuations to show trend direction, and RSI shows the market if it is overbought or oversold. Using different forms of indicators allows traders to verify signals before entering a trade. The concept is not to find a “perfect” indicator, but to have a simple system that performs well on a regular basis. Testers who test indicators on demo accounts and adjust their settings for every pair and timeframe usually do a good job in live markets.
What Are Technical Indicators in Forex?
Technical indicators process past price and volume data to help forecast future price behavior. They help identify entry and exit points with more confidence.
Main Types of Indicators
- Trend Indicators: Track overall direction (e.g., Moving Averages, ADX).
- Momentum Indicators: Measure price strength (e.g., RSI, MACD).
- Volatility Indicators: Gauge market activity (e.g., ATR, Bollinger Bands).
- Volume Indicators: Confirm market participation (e.g., OBV).
Apply one trend indicator and one momentum indicator on a 1-hour chart. For example, use the 50 EMA with RSI(14) to confirm the trend before opening trades.
Trend Indicators and How They Work
Trend indicators help you follow the direction of the market instead of trading against it.
Key Trend Tools
- Simple Moving Average (SMA): Calculates average prices to show trend direction.
- Exponential Moving Average (EMA): Reacts faster to recent price changes.
- ADX (Average Directional Index): Measures the strength of a trend.
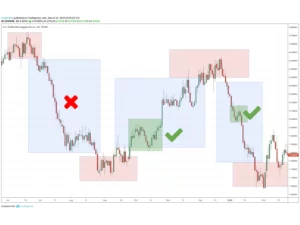
If the 50 EMA is above the 200 EMA, look for buy opportunities. Combine it with price action at support and resistance levels for stronger entries.
Momentum Indicators and Their Use
Momentum indicators help spot when prices are moving too fast or losing strength.
Common Momentum Tools
- RSI (Relative Strength Index): Shows overbought/oversold conditions.
- MACD (Moving Average Convergence Divergence): Reveals momentum shifts.
- Stochastic Oscillator: Useful for timing short-term reversals.
When RSI crosses above 30 after being oversold, consider entering a long trade. Confirm direction using a moving average before acting.
Volatility Indicators for Better Timing
Volatility indicators show how much prices move during a period. This helps traders decide position sizes and stop-loss distances.
Best Volatility Tools
- Bollinger Bands: Identify overextension and breakout setups.
- ATR (Average True Range): Measures the average pip movement per candle.
Use ATR to set stops — if ATR = 50 pips, set stop-loss at 1.5x ATR (75 pips). This prevents being stopped out during normal market fluctuations.
Combining Indicators for Stronger Results
Using multiple indicators helps confirm trades and filter bad signals.
| Indicator | Purpose | Setting |
|---|---|---|
| 50 EMA | Trend direction | Medium-term |
| RSI | Momentum | 14 period |
| Bollinger Bands | Volatility | 20 period, 2 std dev |
Enter trades only when the trend, momentum, and volatility agree. If price is above the 50 EMA, RSI is above 50, and Bollinger Bands are expanding, it’s a valid buy setup.
Setting Up Indicators in MT4 and MT5
Both MT4 and MT5 make it simple to add and customize indicators for better analysis.
Steps
- Open chart → “Insert” → “Indicators.”
- Choose category (Trend, Oscillator, Volume).
- Adjust settings for your pair/timeframe.
- Save templates for reuse.
Use the MT5 Strategy Tester to backtest indicator-based systems with at least six months of data before going live.
Risk Management with Indicators
Indicators support decisions, but risk control determines long-term success.
Key Rules
- Risk no more than 2% of your capital per trade.
- Use ATR to size stops and lot sizes.
- Exit early if indicators weaken.
If RSI drops from 70 to 50 and MACD histogram turns negative, take partial profit or close the position.
Advanced Indicator Tips for Active Traders
Once you’re comfortable with basic setups, customize indicators for your style.
Pro Tips
- Combine EMA and RSI divergences for reversal spotting.
- Add Volume indicators to confirm trend strength.
- Use multiple timeframes: Daily for direction, H1 for entries.
Check RSI divergence on daily charts before trading short-term signals on lower timeframes. This increases accuracy.
FAQs
What are the easiest indicators for beginners?
RSI, Moving Averages, and MACD — they are reliable and simple to interpret.